blog3—shiny app
section 1 :)
introduce COVID19_tracker shiny app
1. here is my app link.
2. why create it?
- The original intention of creating this app was to let people see the data of the epidemic more intuitively, rather than the news of COVID-19 all over the world, but they could not understand the epidemic situation in various places intuitively. I think that when people are very intuitive and simply see the changes and numbers of the epidemic, people can no longer be manipulated by politics or the media (for example, thinking that the epidemic does not exist, the government deceives the people) and can be straightforward Judge this epidemic.
3.how to use it?
you can just pick the app link.
here is this app’s github link:
- https://github.com/etc5523-2020/shiny-assessment-cgon0007 .
- you can clone from this link, and run in you rstudio.(just pick the “run app”)
4.what function about this app?
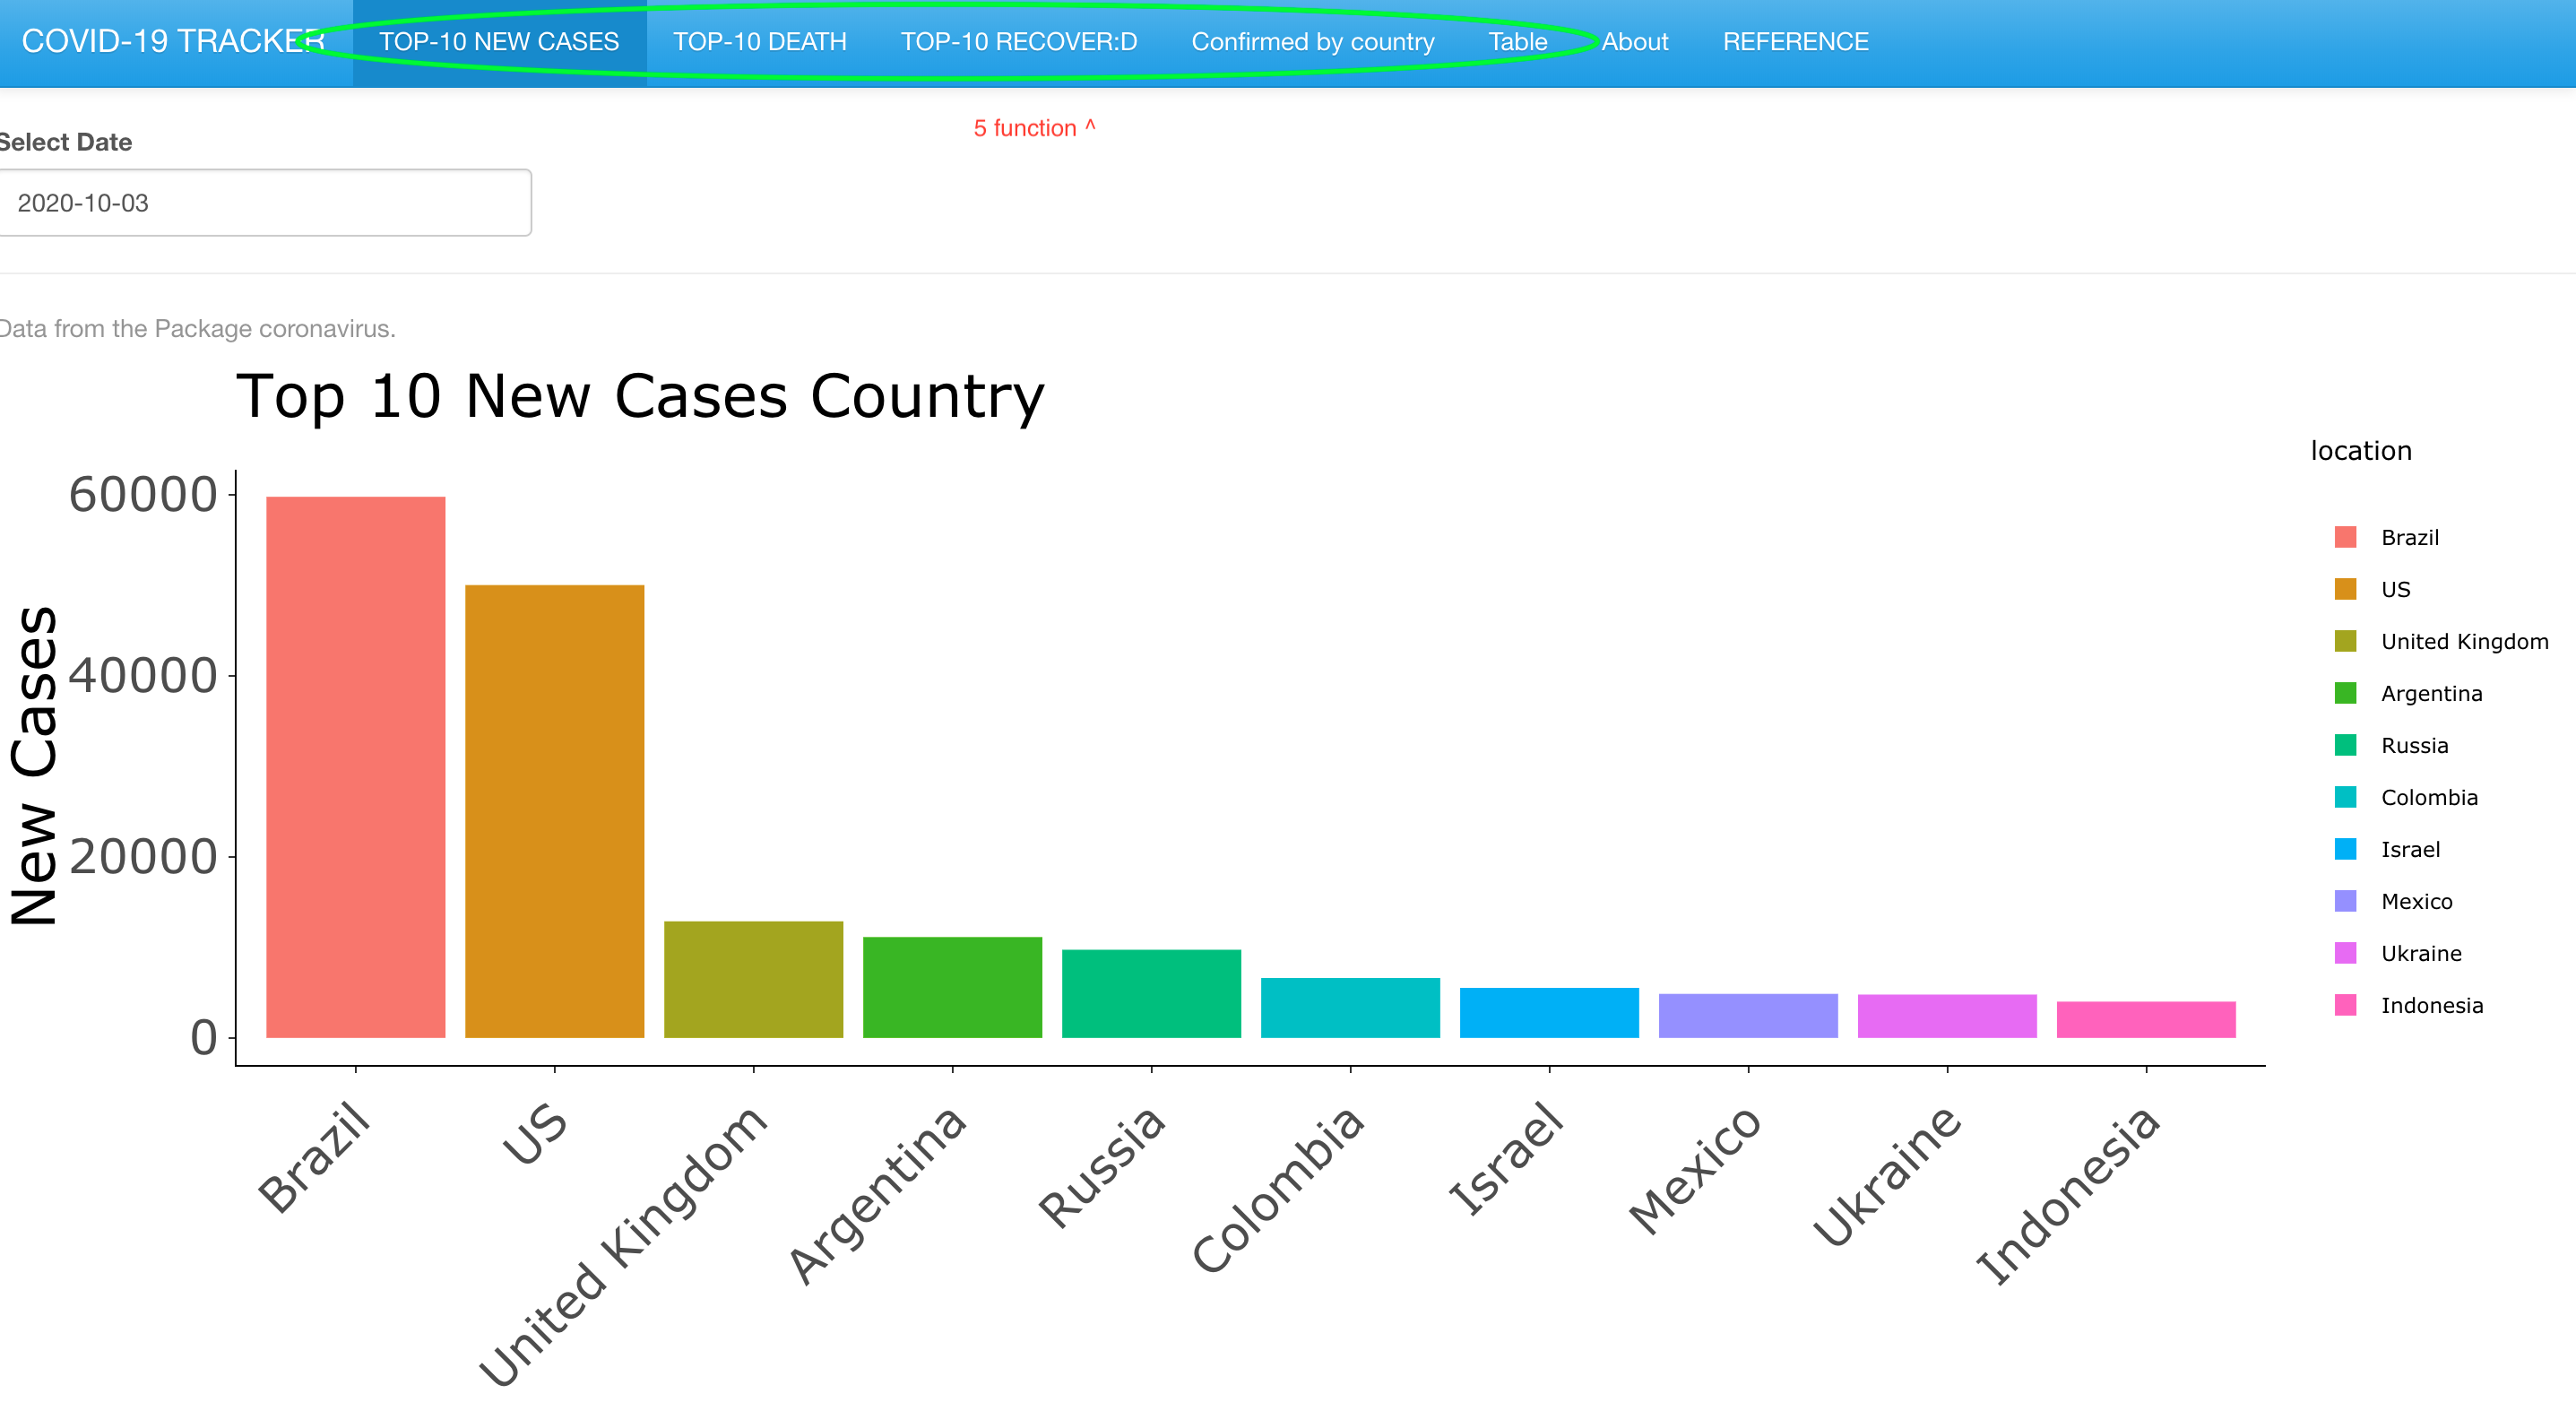 * This app can intuitively display the countries with the most confirmed, deaths, and recovery, and it can also directly see the changes during the epidemic in different countries, and use this as a basis to judge whether the epidemic prevention measures in different countries are effective.
And at the end, there is a table to see all the data in detail, which is convenient for people to check.
* This app can intuitively display the countries with the most confirmed, deaths, and recovery, and it can also directly see the changes during the epidemic in different countries, and use this as a basis to judge whether the epidemic prevention measures in different countries are effective.
And at the end, there is a table to see all the data in detail, which is convenient for people to check.
- more information see the readme.MD *
. . . . . . . . . . . . . . . . . . . . . . . . . . . . . . .
section2-Self Review
1 What did you do well?
- this app has 5 function, top-10 confirmed, deaths, and recovery ,the line about covid from many countries.
- some detail do well, eg. plot’s title, color, weight, xlab’s angle
- good choice about plot type, bar and line are very vivid and readable.
2 What are the points you can improve on?
- I want use dashboard make my app more beauty.
- the data not only from one package, it should from the several database, because that more preciseness.
3 What are some things that you’d like to add that’s plausible?
- add one function, which is world map according the number of confirmed.
- I want app can get the newest data from internet, and auto download it.
- I want to add a model that can predict the growth rate of different regions.
4 What are some things that you’d like to add that cannot be done yet due to limitation in data or technology?
I hope this app can draw a 3D world map, and then display each case on it. If people enter this case, they can see the person’s activity trajectory, just like VR.