COVID-19 in Mexico
hi i am chenjie :D
2020 is not a good period. People all over the world have been badly affected by this virus. For example, we cannot go back to school for offline courses. This is an extraordinary period, so each of us should pay great attention to this epidemic and cannot be taken lightly. First, let’s take a look at popular science.
What is COVID-19?
Corona Virus Disease 2019 (COVID-19), abbreviated as “New coronavirus”, named by the World Health Organization as “Covid-19” refers to pneumonia caused by the 2019 new coronavirus infection.
if i am positve COVID, what happend?
Novel coronavirus pneumonia is mainly manifested by fever, dry cough, fatigue, etc. A few patients are accompanied by nasal congestion, runny nose, diarrhea and other upper respiratory and digestive tract symptoms. Severe cases often have difficulty breathing after 1 week, and severe cases rapidly progress to acute respiratory distress syndrome, septic shock, difficult to correct metabolic acidosis, coagulation dysfunction, and multiple organ failure.
## Warning: Transformation introduced infinite values in discrete y-axis

## Warning: Transformation introduced infinite values in discrete y-axis
## Warning in sqrt(x): NaNs produced## Warning: Removed 94 rows containing missing values (geom_point).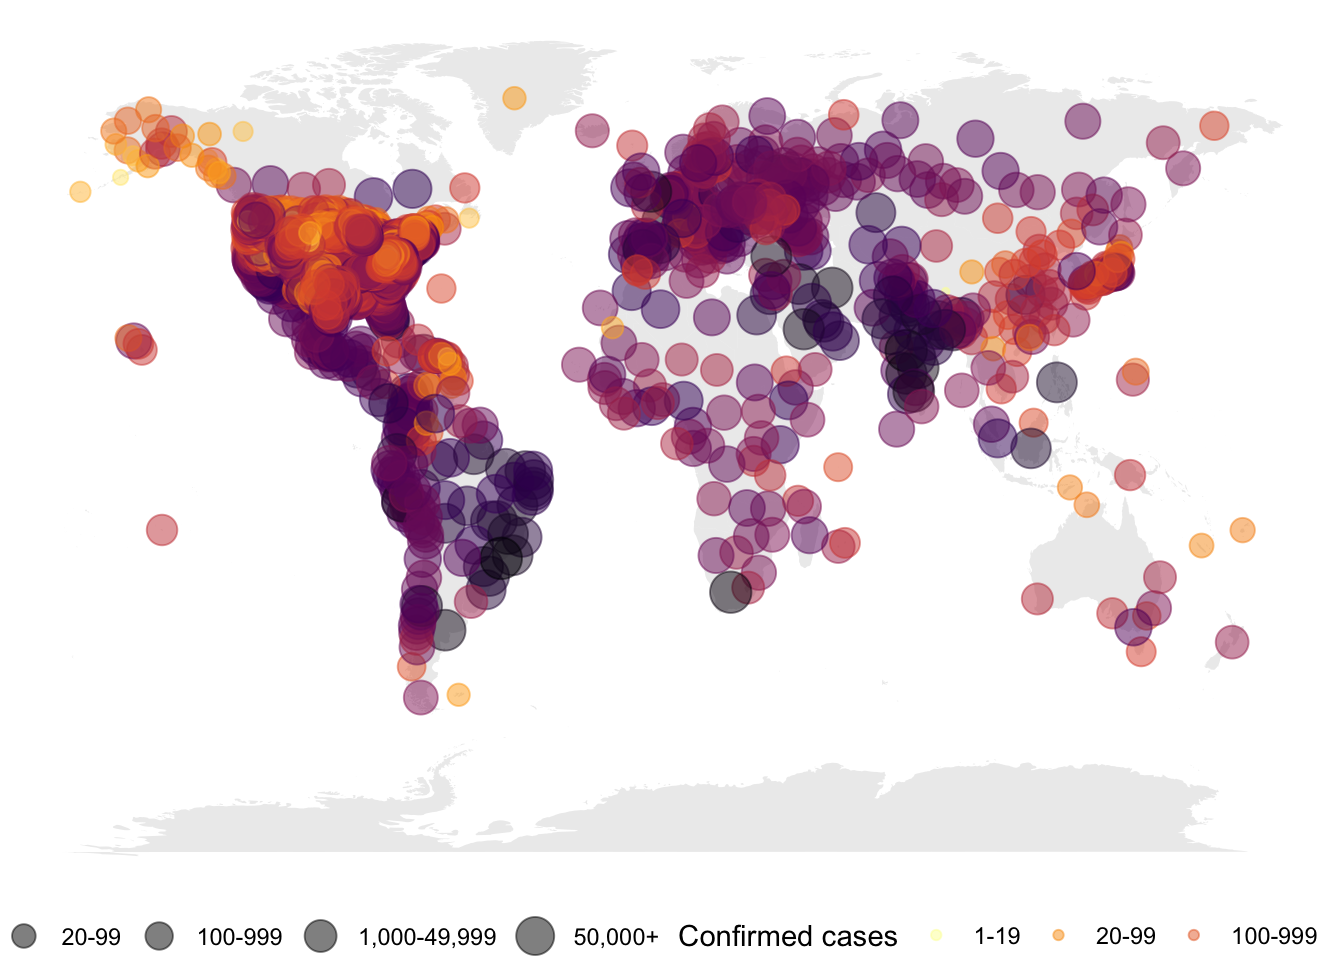 Now that we have a basic understanding of this virus, let’s continue to see how big the coverage of this virus is.
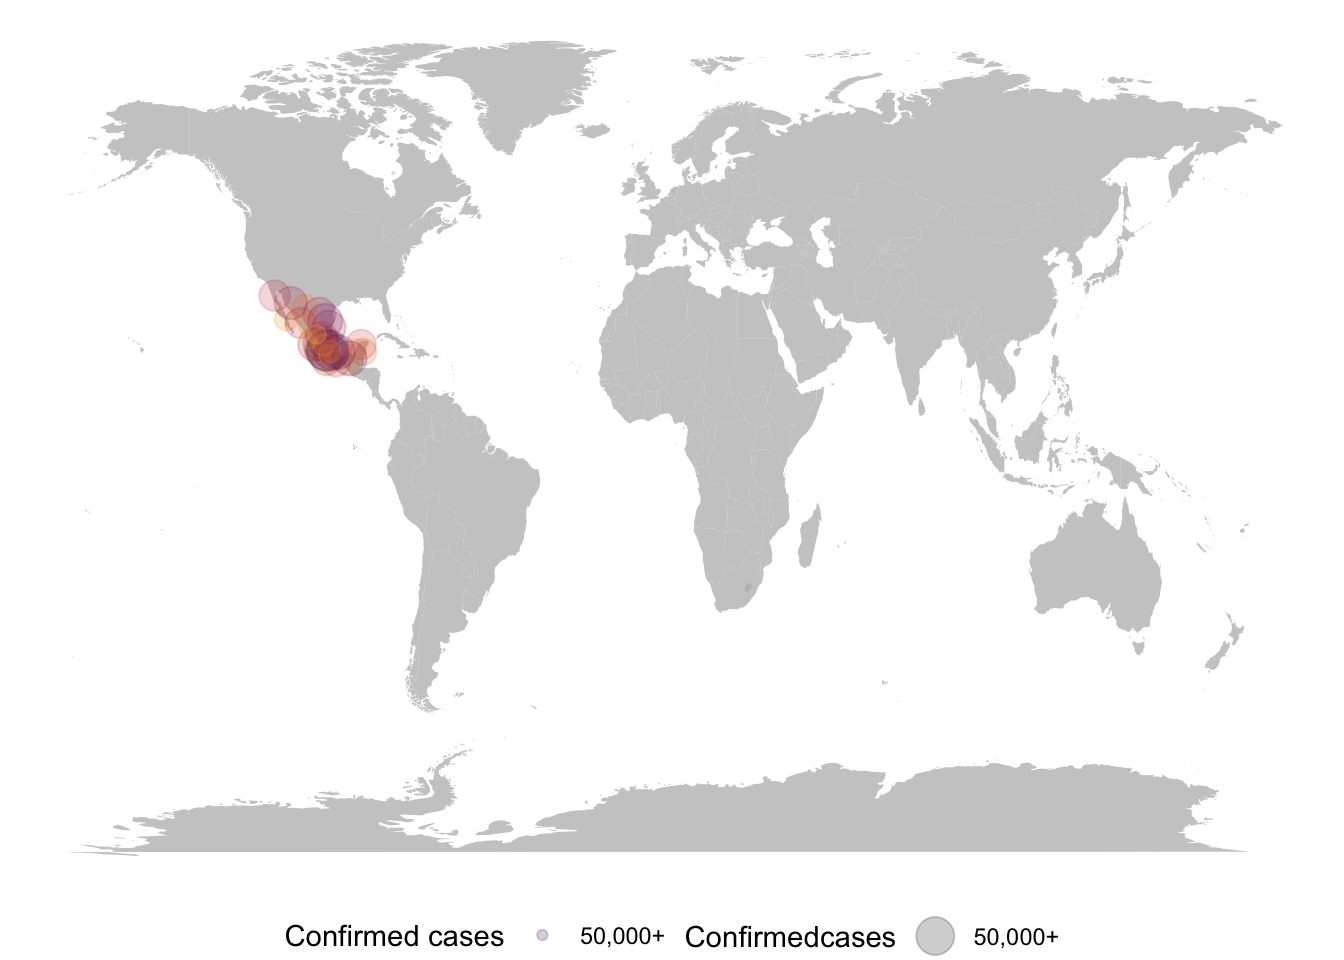
It can be clearly seen from the map that, except for the Antarctic and Arctic, this virus basically covers the whole world, and what I want to study today is Mexico. We can see from the map of Mexico that Mexico is also very infected. One of the countries.
HI:D The 2 part is the table area, where you can find the data you want to find about Mexico. There is the following table for you to explore
## `summarise()` ungrouping output (override with `.groups` argument)| Statistic | Mean | SD. | Min | P33% | P66% | Max |
|---|---|---|---|---|---|---|
| Active | 1311.2188 | 1429.6148 | 79.0000 | 716.0700 | 1220.8600 | 7613.000 |
| Deaths | 2004.9375 | 2136.8083 | 351.0000 | 1028.8300 | 1896.6400 | 10508.000 |
| Confirmed | 18620.0312 | 19178.4573 | 3688.0000 | 7597.9000 | 18946.7800 | 97855.000 |
| Incidence_Rate | 484.4062 | 233.5975 | 109.1902 | 351.8692 | 509.0815 | 1096.301 |
here you can find the Active, Deaths, Comfirmed, and incidence_rate, and the row you can easyly find the SD, MIN, 33%, 66%,and max data, it is very vivid!
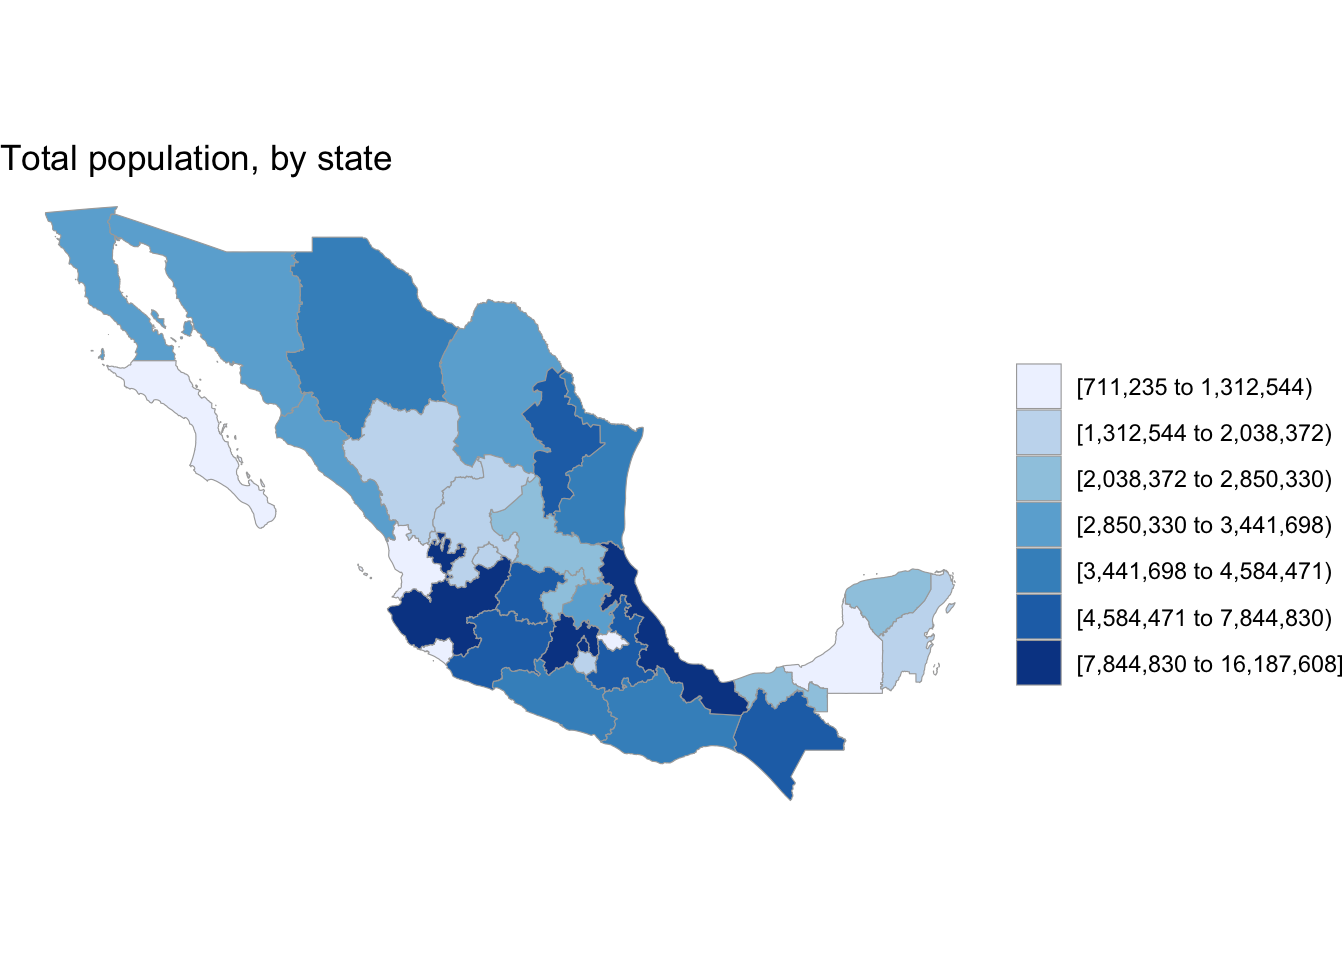
here you can see the all the state data, if you are from mexico, you can find the your hometown’s case.The main content of the 3 part is graphs. You can definitely find the connection between the plots. We can compare and find that in areas with population density, there will be more people who are sick. Although it is a very simple truth, I still Try to show it to you with pictures and let you discover the fun.
And there is also a rule that I found when I looked at the icons and when I checked the data online. If you are familiar with Mexico (not familiar with taco food haha:), you will find that the place with the most patients is not the most developed economy place.
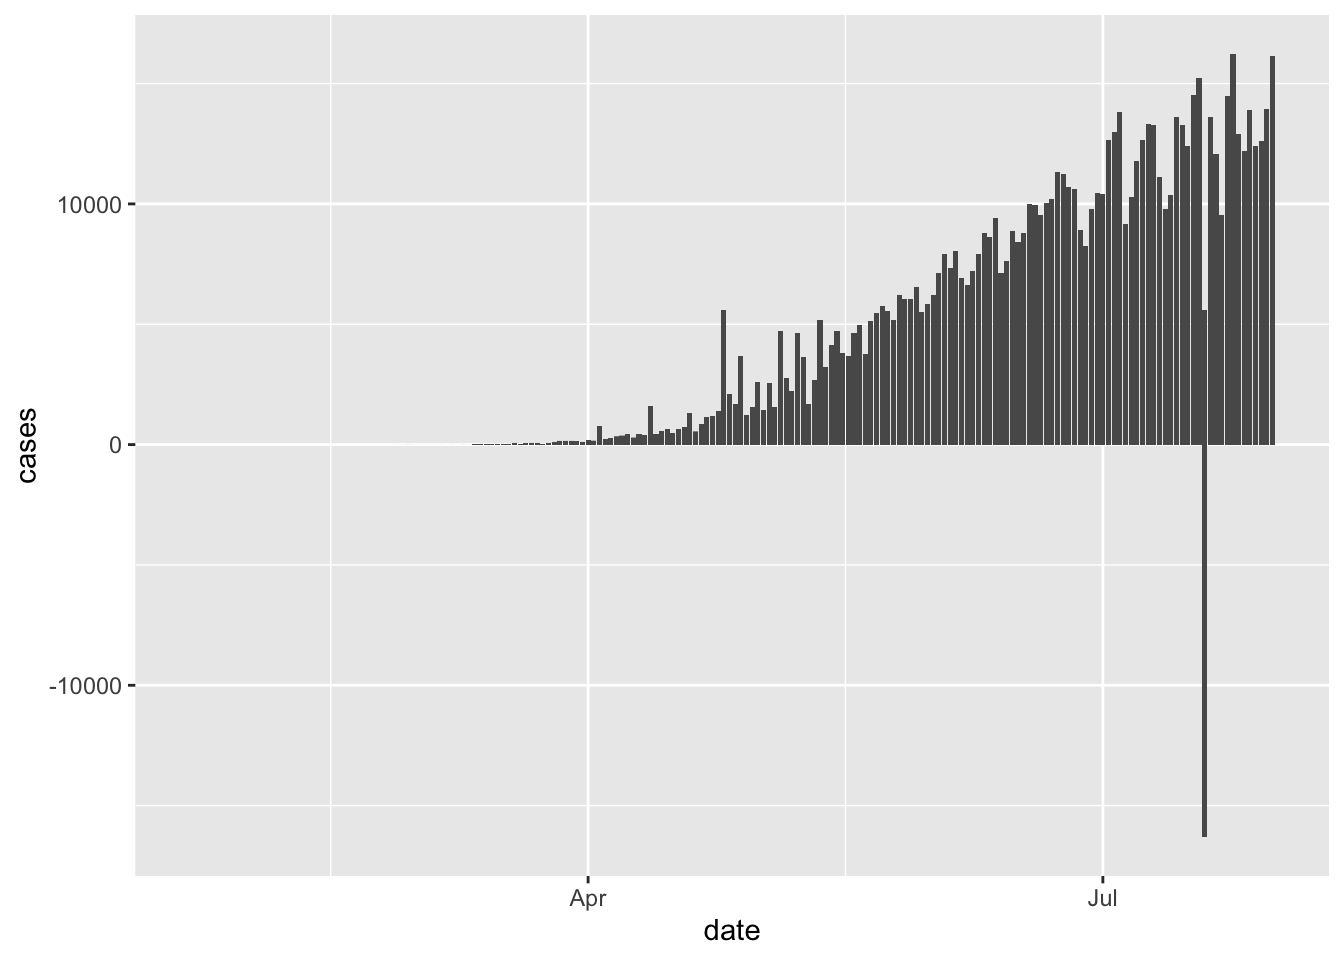 here is the recover case plot,and you can find the 7_19 is a bad day,because there are confirmed new 16298 cases.
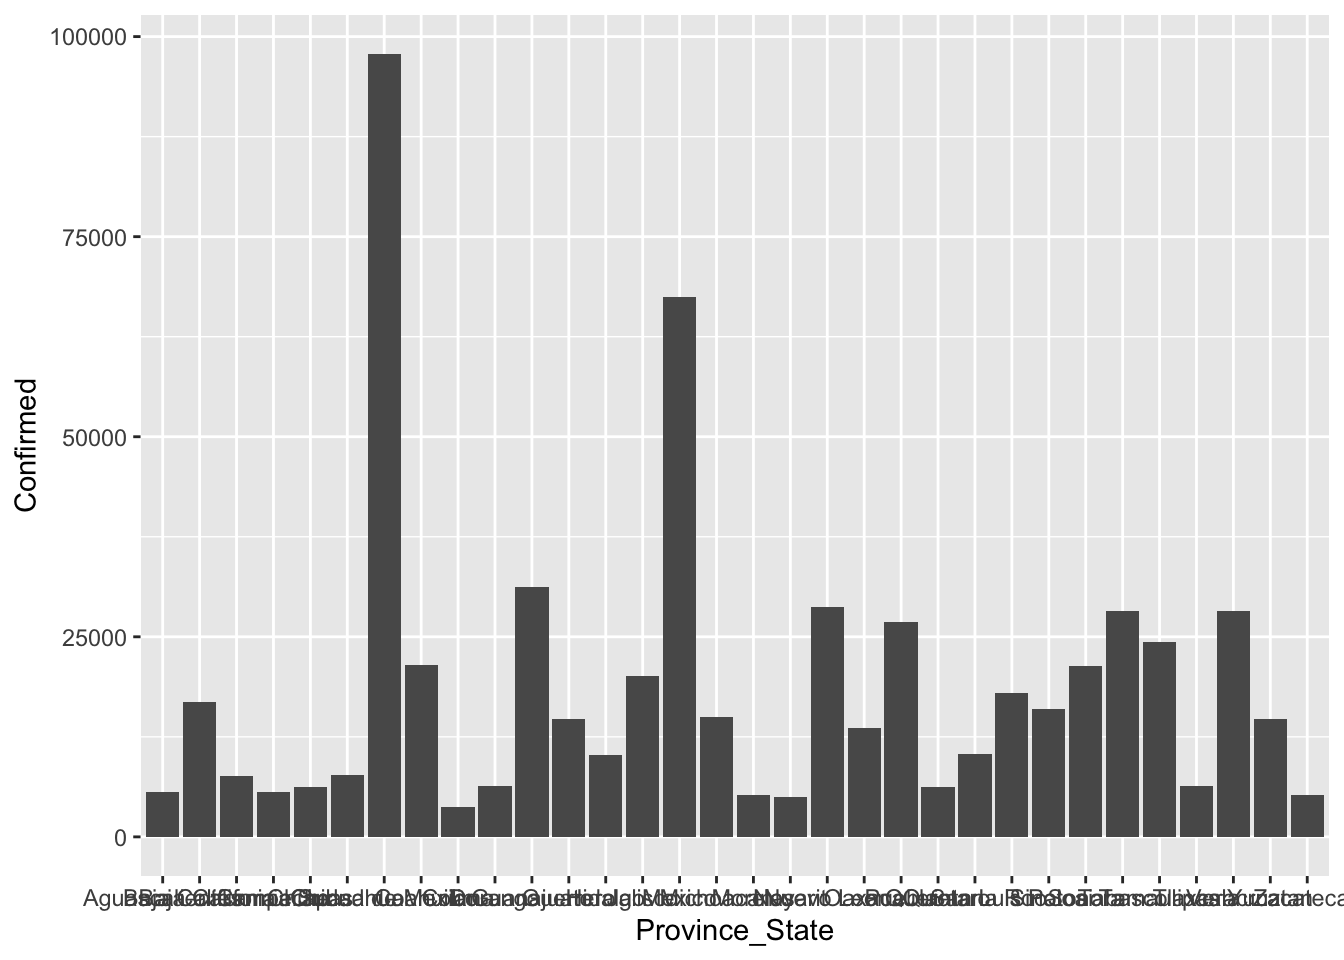 here is the newest confirmed cases plot,according the different state.
Acknowledge
here is my citation: 1 author = {JHU CSSE}, title = Johns Hopkins University Center for SystemsScience and Engineering , publisher = {JHU CSSE}, year = {2019}, url = {https://link.zhihu.com/?target=https%3A//systems.jhu.edu},
2 @Manual{, title = {coronavirus: The 2019 Novel Coronavirus COVID-19 (2019-nCoV) Dataset}, author = {Rami Krispin and Jarrett Byrnes}, year = {2020}, note = {R package version 0.3.0}, url = {https://CRAN.R-project.org/package=coronavirus}, publications = Rami Krispin and Jarrett Byrnes (2020). coronavirus: The 2019 Novel Coronavirus COVID-19 (2019-nCoV) Dataset. R package version 0.3.0. }